Scenario for Ad-Hoc chart report: As a ticket administrator at Guard First, you will monitor the progress of tickets created by stakeholders of ongoing assessments. As part of your responsibilities, you are given a task to produce a chart report that shows the number of tickets owned by stakeholders. To meet this report objective, you will need to use the 'Tickets (Detail)' predefined domain.
The rest of this section describes the procedural steps to create a chart report using the 'Tickets (Detail)' domain.
To create a chart report:
- Go to Analytics > Analytics and Reporting to launch the JasperReports Server.
- On the Create menu, click Ad Hoc View.
- The Data Chooser page appears. Click Domains, locate the 'Tickets (Detail)' domain, and select it. After selecting the domain, click Choose Data.
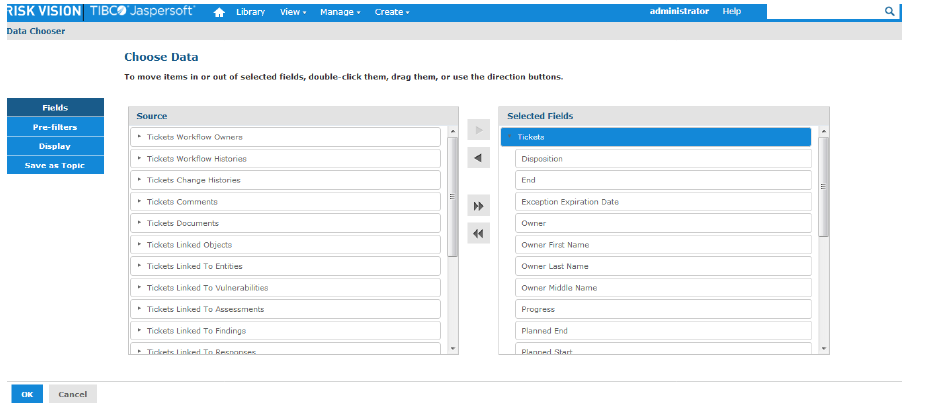
- The Data Chooser options appear with the Fields tab selected. On the Fields tab, expand the 'aglssd_ticket' table in the Selected Fields pane, Ctrl-click the Owner, Progress, Status, Ticket Type, and 'Title fields, and click > at the top between the source and selected fields pane to move the fields to the Selected fields box. Click < arrow to remove the selection.

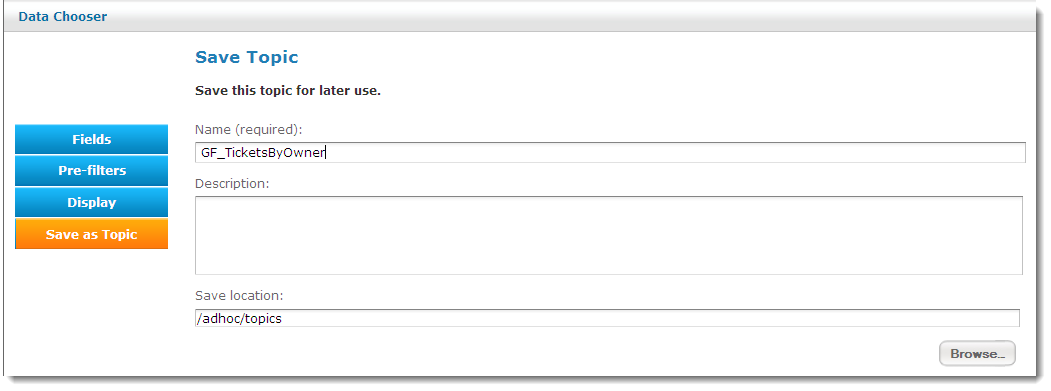
- Click the Save as Topic tab to save the topic for later use. Enter 'GF_TicketsByOwner' in the Name (required)field. Optionally enter description in the Descriptionfield, and click Browse to choose a location in the repository for the topic. By default, the topic will be saved to the
\adhoc\topicslocation in the repository.
- After specifying the required details on all tabs, click Chart.
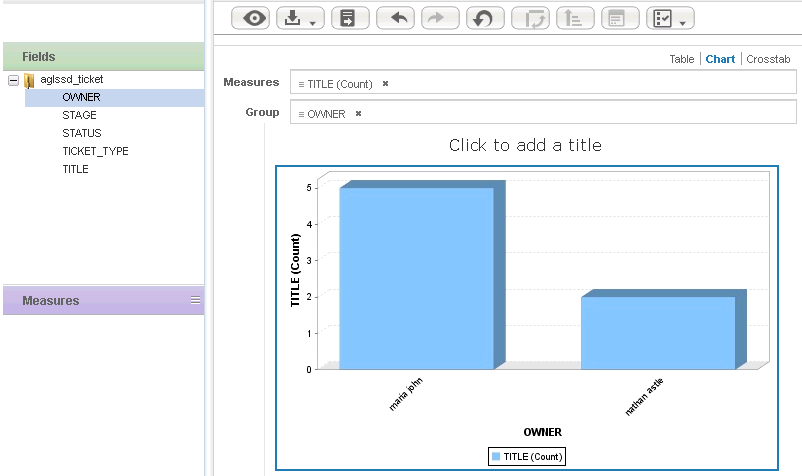
- The Ad Hoc Editor appears. In the Fields pane, drag the OWNERfield in the Group layout, and drag the TITLEfield in the column layout. After you drag the fields, a 3D Bar chart is created by default. The unformatted 3D Bar chart appears as:

- Click the
 icon and choose Save Ad Hoc View and Create Report. In the Save Ad Hoc View and Create Report dialog, enter 'GF_TicketsByOwner' in the Data View (required)field and enter a name in Report Name (required)field


