Users can select a default dashboard or report to display on the Welcome page, allowing them to monitor, analyze, and review data and metrics relevant to them.
 | Any default dashboards selected at the user-level will override role-level default dashboards. Role-level default dashboards override any system-wide default dashboards. |
To select a default dashboard or report:
- Click User Settings in the top-right of the page, then click Dashboards.
 The Dashboards settings.
 - Click Edit.
 The Dashboards settings after clicking Edit.
 - Click the Analytics... button beside the Default Dashboard field.
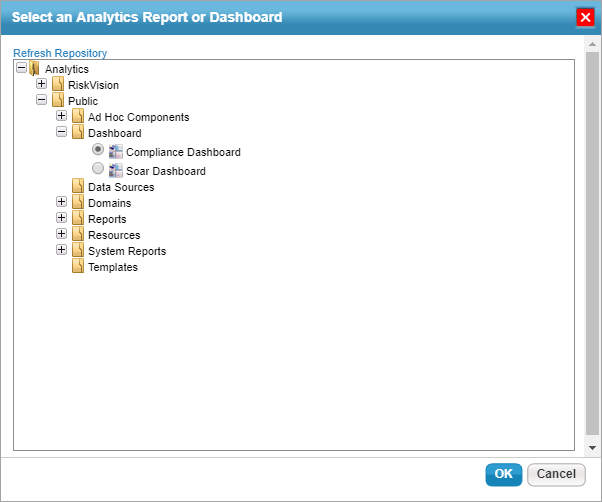
- Click the + icon beside a folder in the tree to display sub-folders as needed.
- Navigate to the location of the dashboard or report you wish to select, then click the radio button to select it. If the report was recently added and is not appearing in the tree, click Refresh Repository to load it.
 The Select an Analytics Report or Dashboard window.
- Click OK.
- Click Save when finished or Cancel discard your changes.


