
The chart parameters determine which objects, such as programs and entities, to run the dashboard chart against. The parameters apply to the dashboard only. You can either set all charts to use the same parameters or set the parameters for each chart.
To set up parameters:
- Go to Analytics> Dashboards and Reports.
- Locate the dashboard to which you want to add a chart, and open the details.
- Expand the Dashboard groups in the navigation pane.
- Select the group to display a list of dashboards.
- Select the dashboard, and click Details.
If chart data is available, the chart runs and displays the results on the dashboard details page.
- Click Parameters. The Select a Parameter Configuration dialog appears.
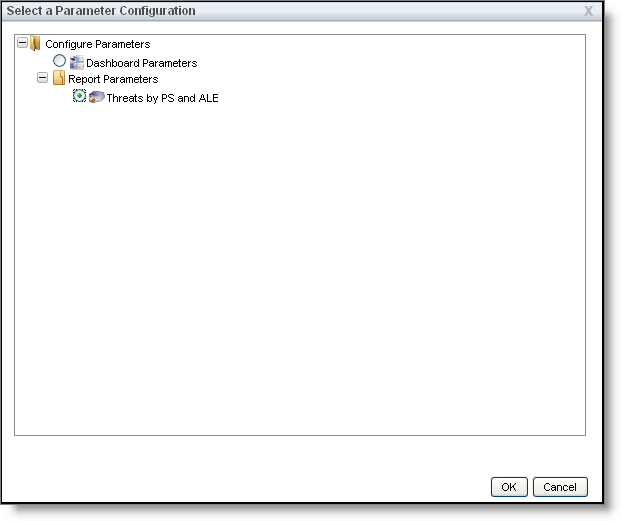
Expand Configure Parameters, and select one of the following options:
Dashboard Parameters. To set similar parameters for all charts.
Chart Parameters > report name. To set different parameters for each chart.
Click OK. The Edit Report Parameters or Edit Dashboard Parameters dialog appears.
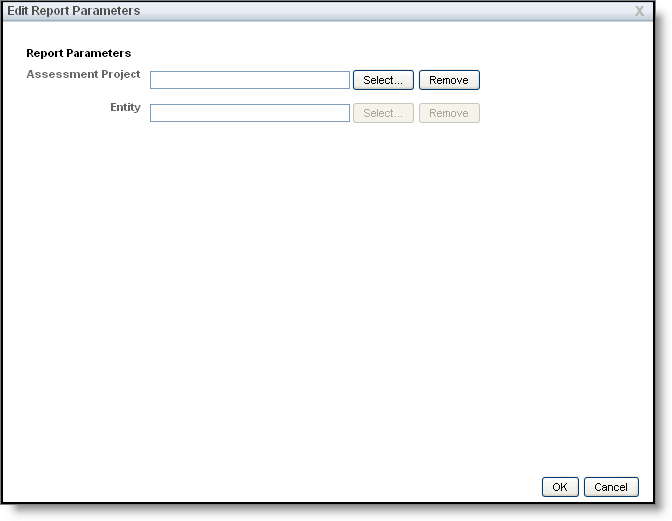
Select a program, select entity, and then click OK.


The dashboard displays the report results using the parameters that you have set.

