
A dashboard can contain any RiskVision solution chart. The chart must be defined before you can add it to a dashboard. However, each dashboard can run the chart with different parameters.
To add a chart:
- Go to Analytics > Dashboards and Reports.
- Locate the dashboard to which you want to add a chart, and open the details.
- Expand the Dashboard groups in the navigation pane.
- Select the group to display a list of dashboards.
- Select the dashboard, and click Details.
If chart data is available, the chart runs and displays the results on the Dashboard Details page.
- Click Add Content. The Select one or more Charts dialog appears.
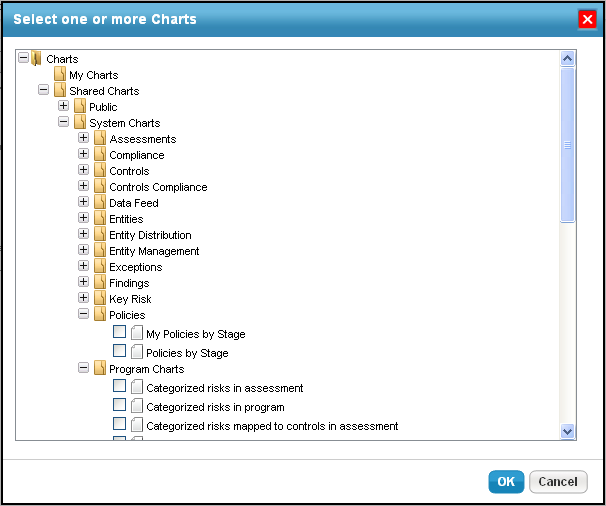
Locate and select the charts you want to add.
Click OK.

The chart displays on the dashboard details page with the chart results if data is available and no parameters are required. Otherwise, the chart displays with a parameter error.


