
After you create the 'GF_VulnerabilitiesfromScanners' data view, the appearance can be improved; by changing the labels, formatting the fields, adding space between columns, and so on.
The rest of this section will help you understand how to format the 'GF_VulnerabilitiesfromScanners' data view.
To format the table report:
- Optional. To open the report,
- In the JasperReports Server, click Search Results on the View menu. In the Searchfield, enter the view name, and click the search icon. The Search results appear, displaying reports and views that match the search criteria.
Or
If you know the location of view in the repository, go to View > Repository menu. - After you locate the ad hoc view, click the view, or right-click in the view row and choose Open in the context menu.
- In the JasperReports Server, click Search Results on the View menu. In the Searchfield, enter the view name, and click the search icon. The Search results appear, displaying reports and views that match the search criteria.
- Optional. At the top of the Fields pane, click
 and choose Change Source or Select Fields. If you choose Change Source and perform any changes, all the report data and its formatting is lost. Hence, it is recommended to preserve the source. To add or remove fields, choose Select Fields. You can remove those fields which are not in use in the report.
 - At the top of table, click the text Click to add a title and enter the title as 'Vulnerabilities from Scanners.'
- Optional. To change the display name of a table column, right-click the column, and choose Edit Label in the context menu. Enter a new display name in the label field and click Submit. Similarly, change the display name for other columns.
- Optional. If a column name is lengthy and occupying more space than its data, right-click the field and choose Delete Label in the context menu. However, the label is not displayed when you run the report.
- In Measures, select the Spacer and drag-and-drop into the table before the 'Identifier' column to add space to; help you read data easily. Similarly, add a Spacer to adjust the spacing for Source and Cvss Score columns as well.
- Mouse over the column,and move the mouse to the column border. When the splitter appears, hold the left-click and drag the mouse left or right to adjust the column width. This enables the report to fit within the margins of the page layout.
- Optional. Right-click a column in the report and choose Move Left or Move Right move a column left or right in the table.
- Optional. For fields displaying date, right-click in the column, go to Change Date Format in the context menu, and choose a format, Oct 16, 2012 9:43:42 PM, for example.
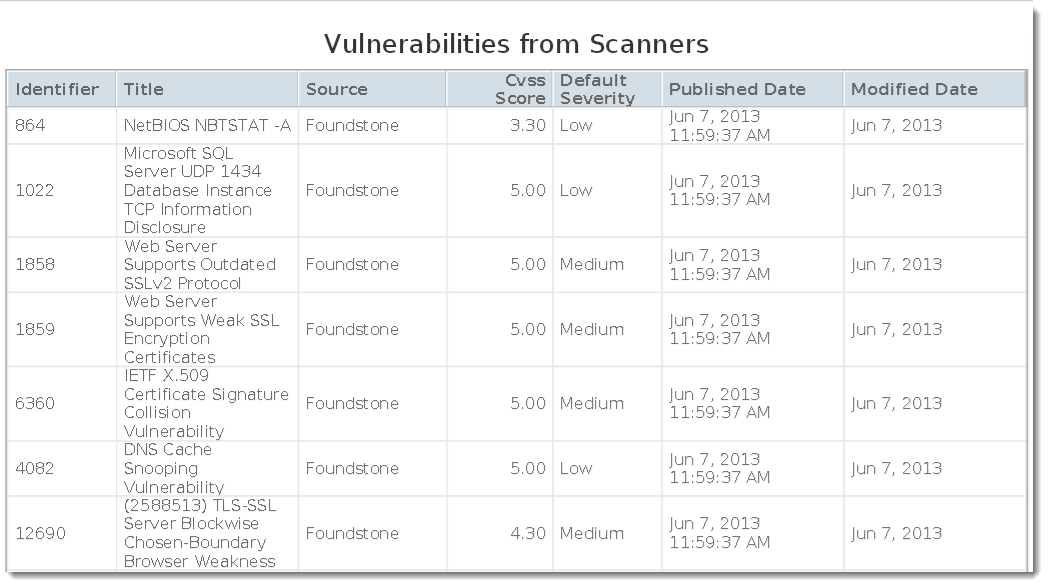
- Now that you have applied the formatting, the 'GF_VulnerabilitiesfromScanners' table report appears as:
- Click the
 icon and choose Save Ad Hoc View to save the view.

Limitation
When a table report containing a column displaying the Ids of an object is exported to save in the .xls format, the IDs in the cells will be changed to zeros by the Microsoft(R) Excel application if an Id is more than 15 digits long.

