
This article provides details on the charts displayed on the Compliance Dashboard. For information on accessing it, see the Access & View the Compliance Dashboard article.
 The Compliance Dashboard.
This dashboard displays the following data for the currently selected program:
- Average Compliance Score: Displays the current score and comparison data from the last 30 days. If the score has increased in the last 30 days, it'll be displayed with an up arrow and a green background. If the score has decreased in the last 30 days, it'll be displayed with a down arrow and a red background.
- Open Assessments: Displays the current number of open assessments. If the number of assessments has decreased in the last 30 days, it'll be displayed with a down arrow and a green background. If that number has increased, it'll be displayed with an up arrow and a red background.
- Open Mitigations: Displays the current number of assessments with open mitigations, which consist of tickets and findings. If the number of mitigations has decreased in the last 30 days, it'll be displayed with a down arrow and a green background. If that number has increased, it'll be displayed with an up arrow and a red background.
- Open Findings/Open Tickets/Open Exceptions: Displays the current number of open findings, tickets, or exceptions. If the number of these objects have decreased in the last 30 days, each will be displayed with a down arrow and a green background. If that number has increased, each will be displayed with an up arrow and a read background.
- % Entity Criticality: A pie chart that represents, in percentages, the criticality assigned to the entities in the program. Clicking a portion of the chart will open a new tab with an Entity Compliance Detail Report for the selected criticality level. Clicking a criticality level below the pie chart (e.g. High, Low, Medium, or Unknown), will hide that data from the chart.
 The % Entity Criticality pie chart. Clicking a criticality level will hide it from the chart, while clicking a section in the chart will open an Entity Compliance Detail report in a new tab.
- Program Compliance Score Trend: Displays the average compliance score for the selected program. Hovering your cursor over a point in this chart will display the score and its date. Clicking Program Average Compliance Score below the chart will hide its data.
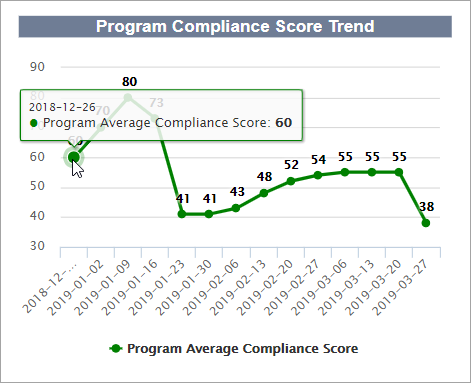 The Program Average Compliance Score chart.
- Open Assessments: Displays the number of open assessments grouped days open (e.g. > 30 to <=60 [more than 30 but less than 60]). Hovering your cursor over a bar in this chart will display the date range and the number of assessments. Clicking Assessment Count below the chart will hide its data.
 The Open Assessments chart.
 - Top 10 Oldest Mitigations: Displays a list of ten oldest tickets and findings, along with their mitigation IDs, entity or entity collection, criticality, and age in days. Clicking a mitigation ID will open the ticket or finding in a new tab. Clicking a column will display the chart options, including table formatting, show/hide columns, filters, sorting, and resizing.
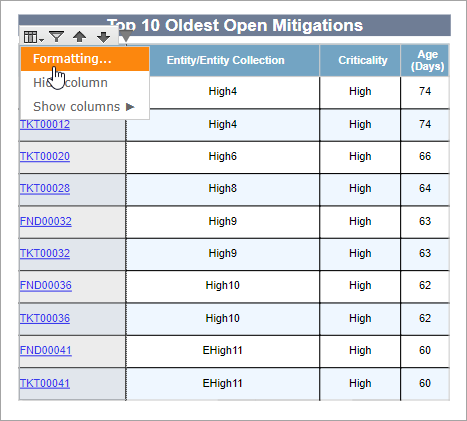 The Top 10 Oldest Mitigations chart. Clicking a column will display the chart options.
- Lowest Compliance Scores: Displays the entities or entity collections with the lowest compliance scores, along with their entity types, compliance score, and criticality. Clicking a column will display the chart options, including table formatting, show/hide columns, filters, sorting, and resizing. Clicking Show All will open the Assessment Compliance Score Details report in a new tab.
- Top 10 Control Issues: Displays the controls with the highest number of total open and closed mitigation items linked to open and closed (but not archived) assessments. Clicking a column will display the chart options, including table formatting, show/hide columns, filters, sorting, and resizing. Clicking a number in the Number of Mitigation Items column will open a Control Mitigation Details report in a new tab.


